Debugging
This page assumes you’re using Visual Studio Code as the debugger. Go to the Run and Debug pane in VS Code to find the different launch configurations.
- Launch extension
- Launch web extension
Launch extension
This opens a new window of Visual Studio Code running as a local extension host.
Open the Sass project you’re using to test in the extension host window.
If you don’t have one you can find several workspace/
directories inside vscode-extension/test/e2e/ in this repository.
Set breakpoints
Find node-server.js in the vscode-extension/dist/ folder to set breakpoints. A good place to start is to search for the request handlers in server.ts like onCompletion and onHover.
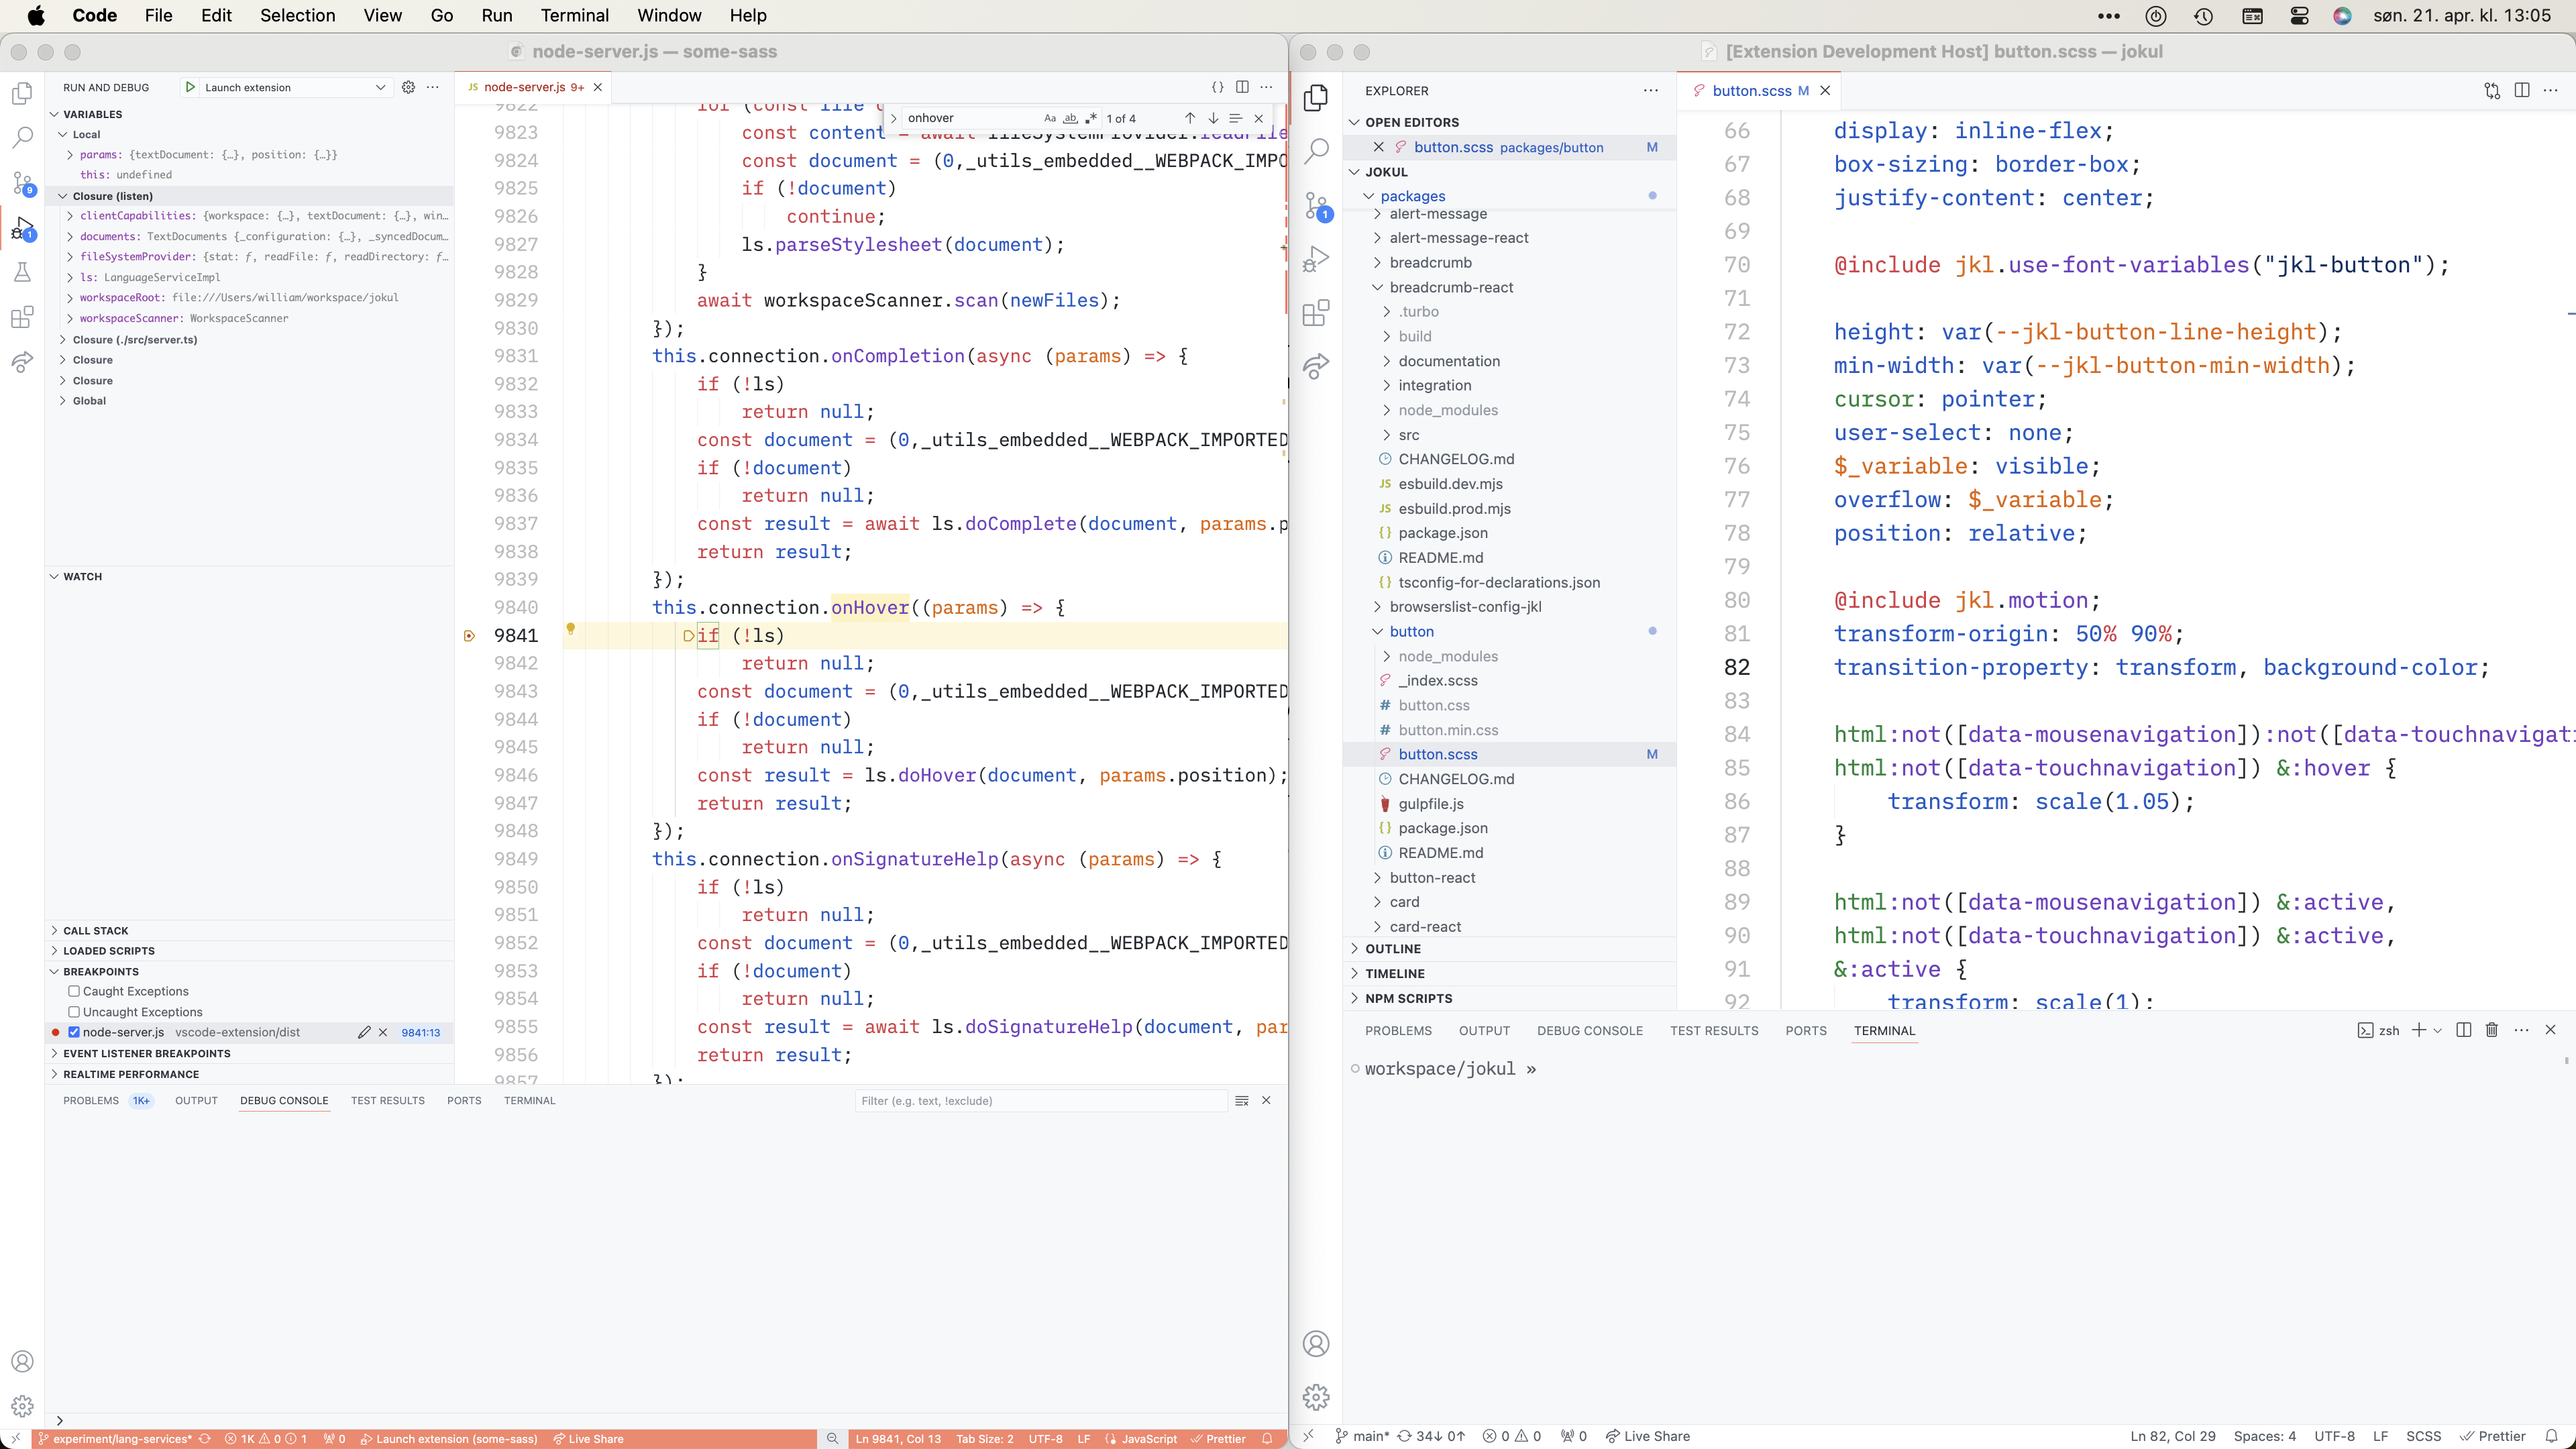
Restart the debugger after building to see any changes you make in the code.
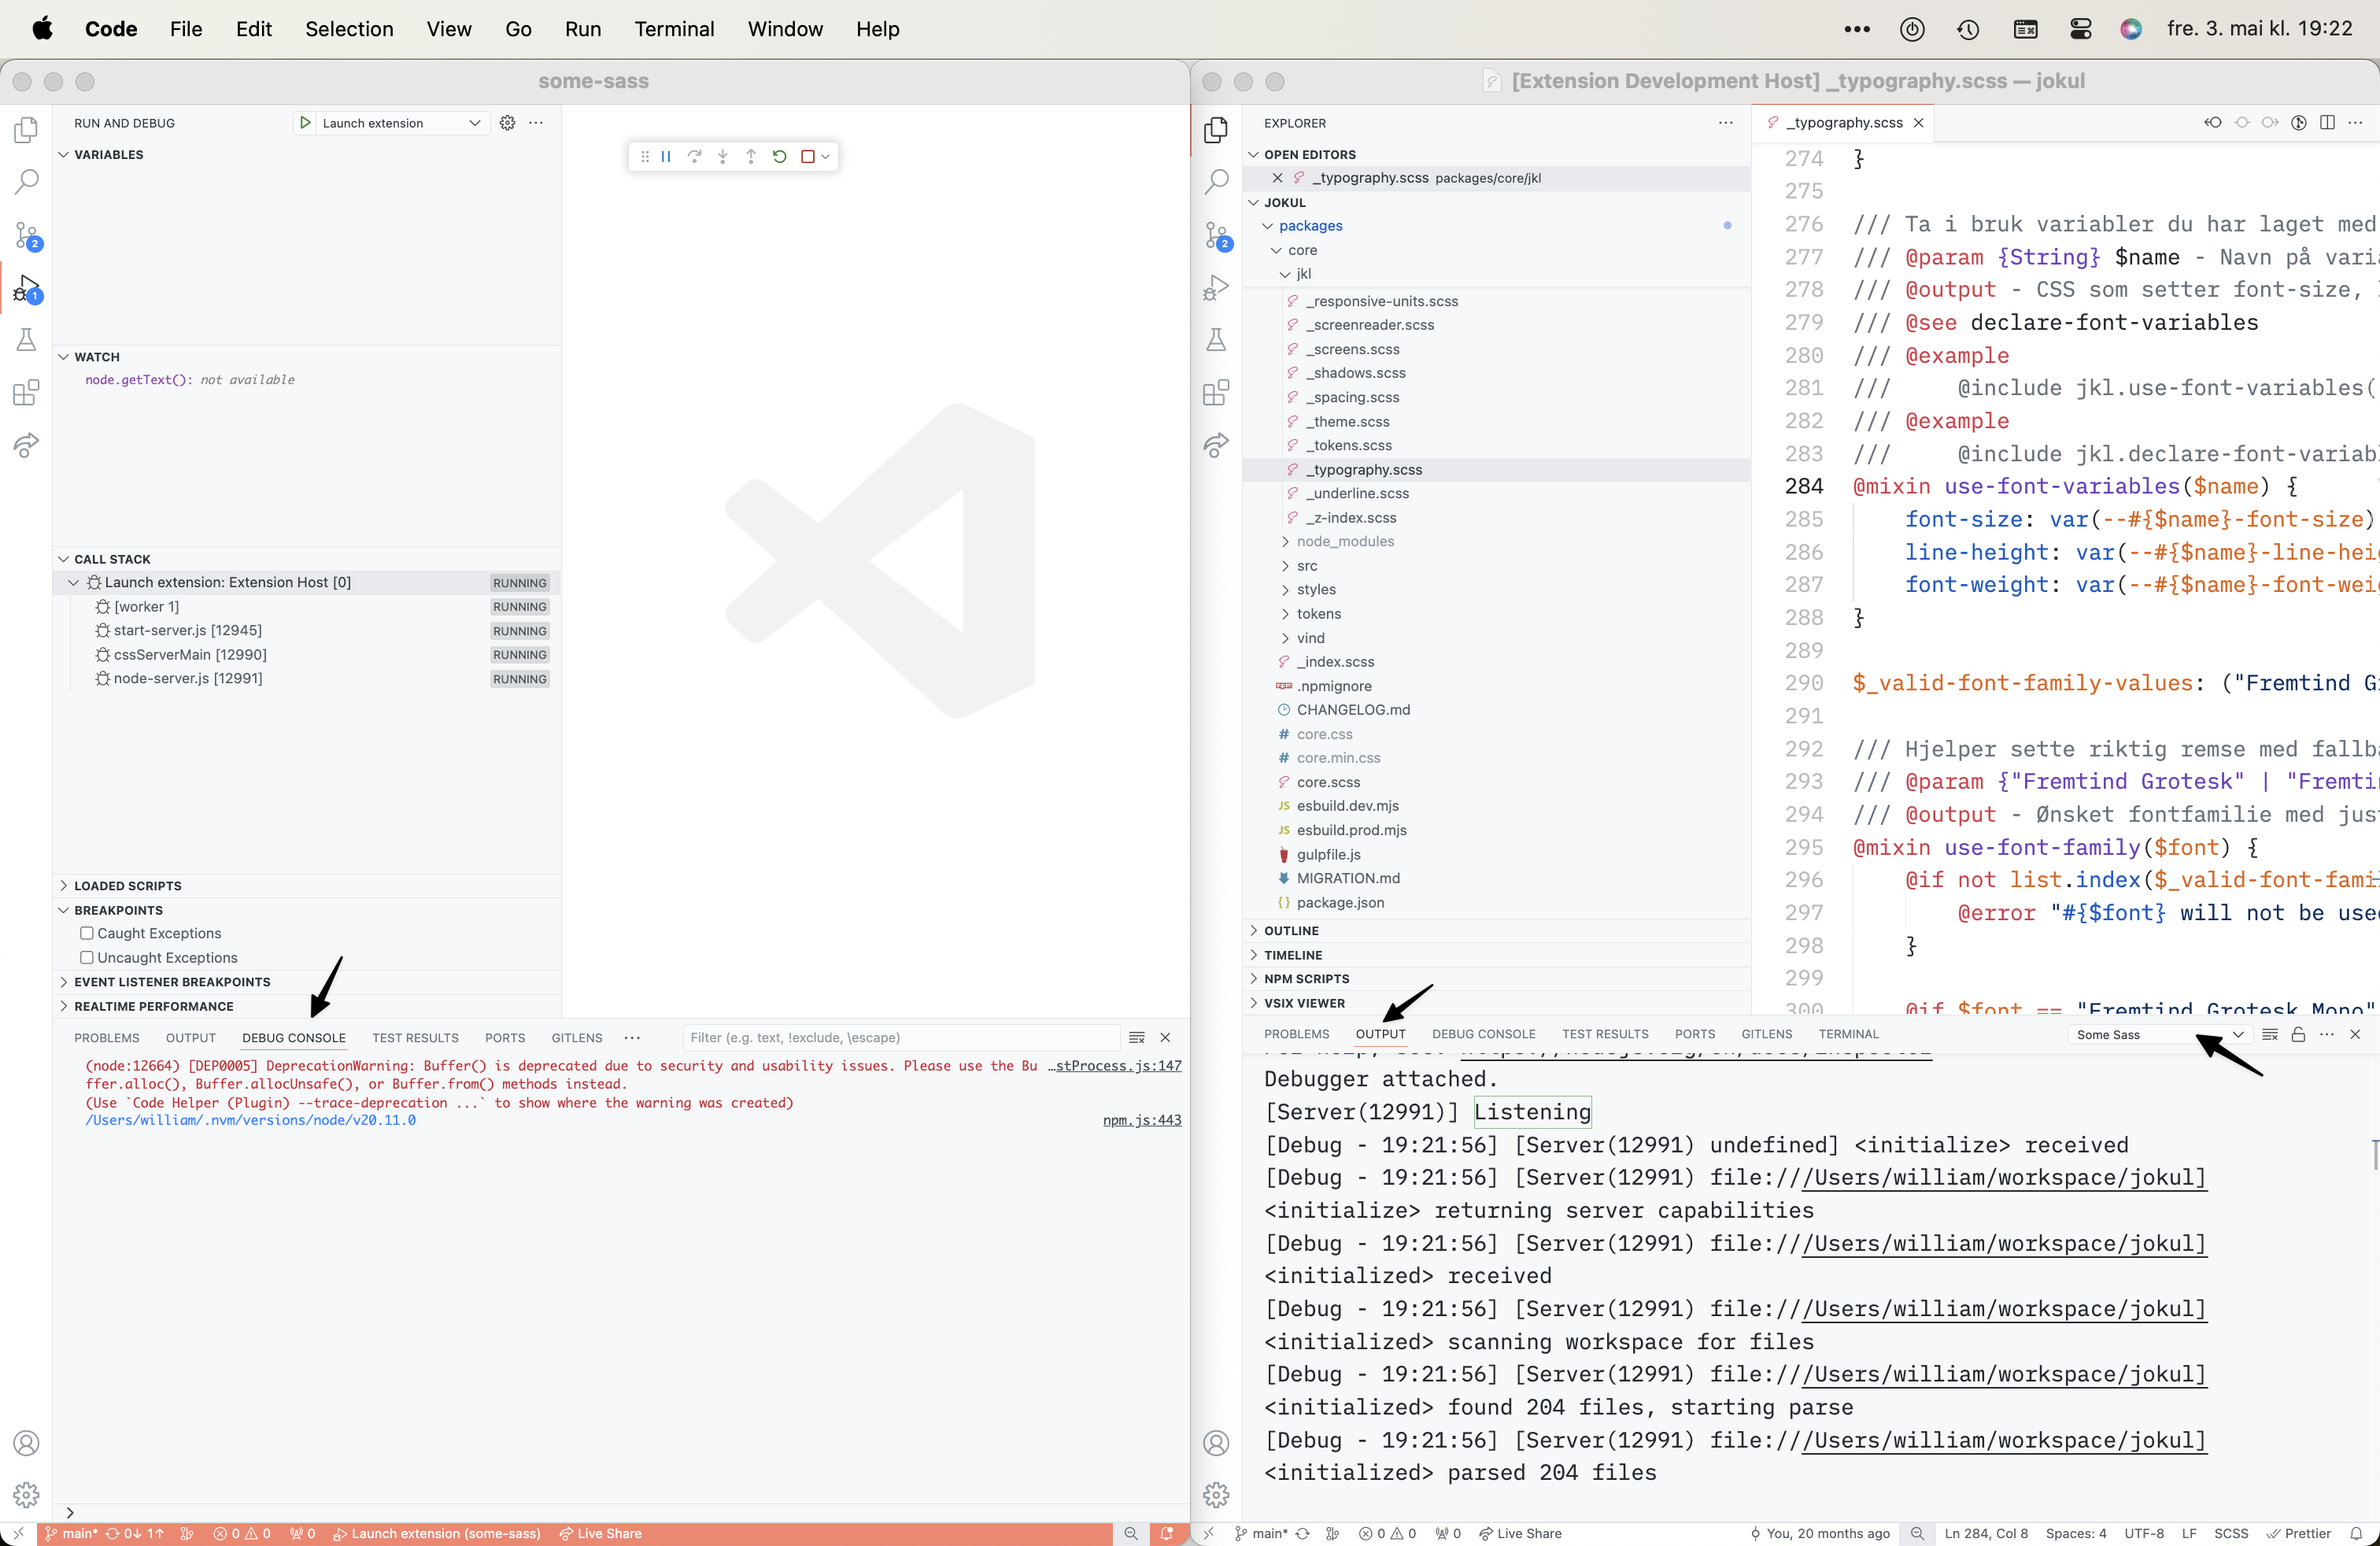
See log output
You’ll find the log output in two places:
- The Debug console in the window where you started the debugger.
- The Output pane in the extension host (pick Some Sass from the dropdown).
Launch web extension
This opens a new window of Visual Studio Code running as a web extension host. Open the Sass project you’re using to test in the extension host window.
If you don’t have one you can find several workspace/
directories inside vscode-extension/test/e2e/ in this repository.
Find browser-server.js in the vscode-extension/dist/ folder to set breakpoints.
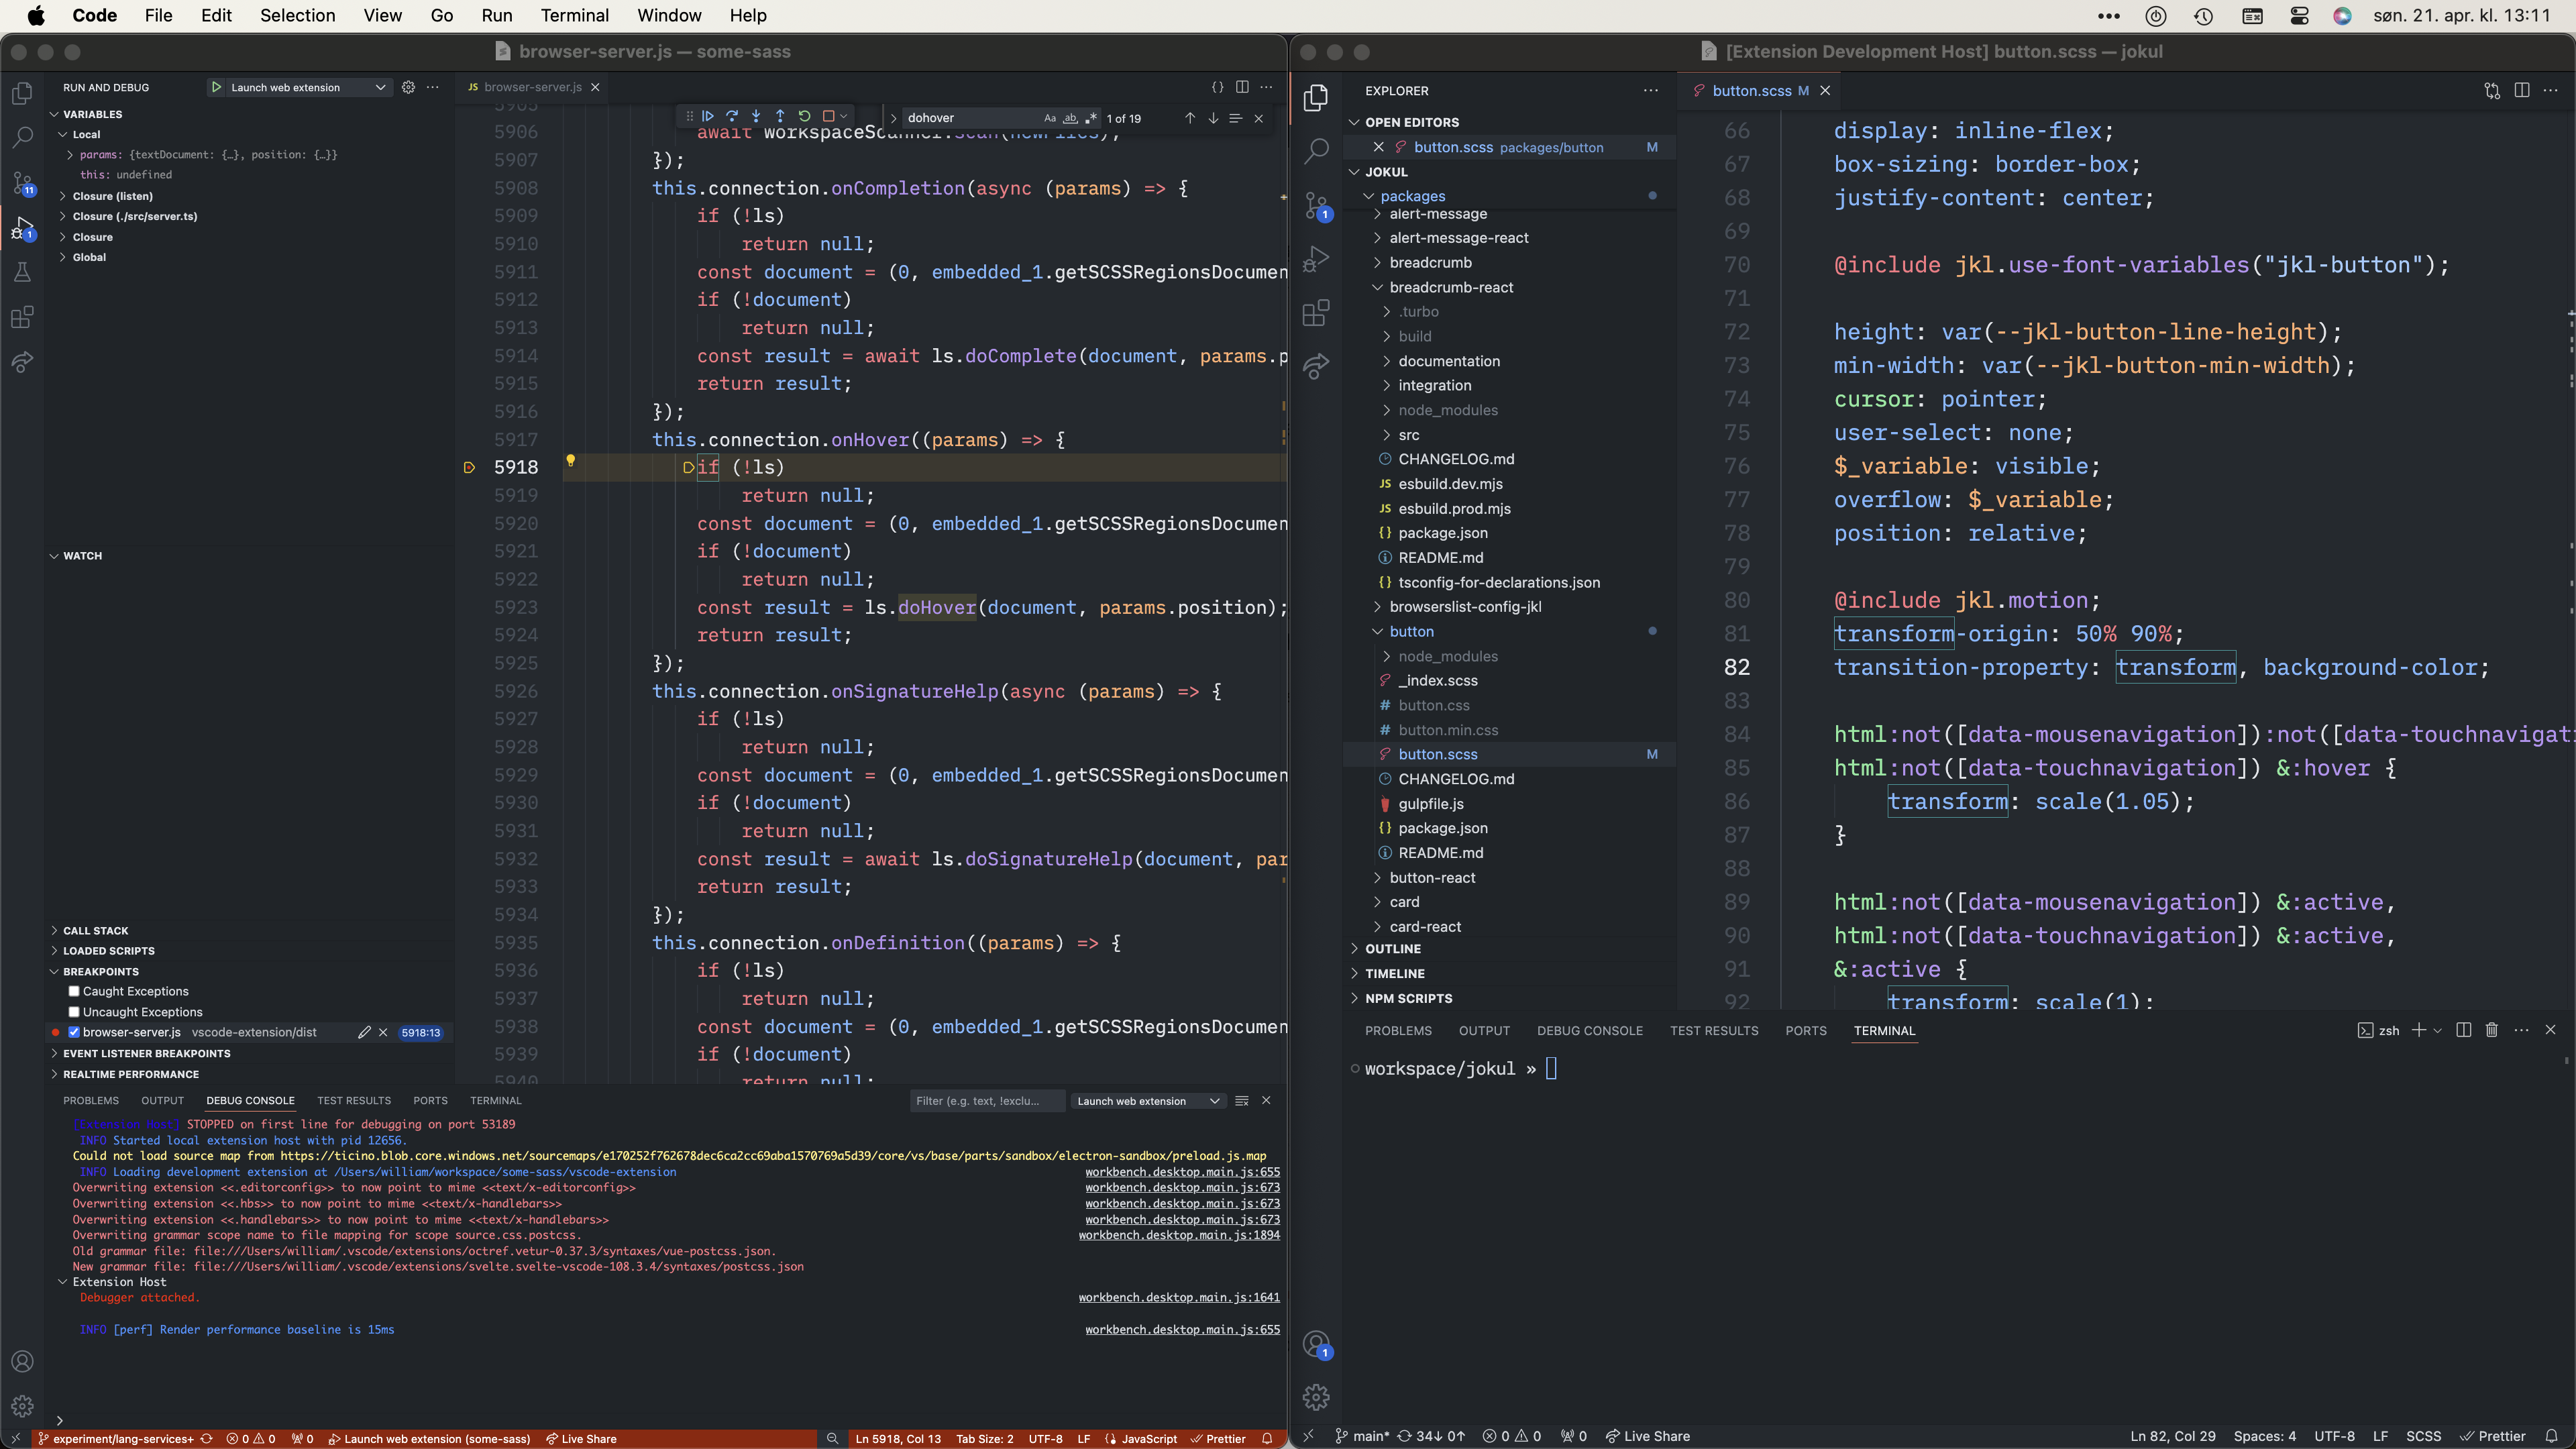
Restart the debugger after building to see any changes you make in the code.
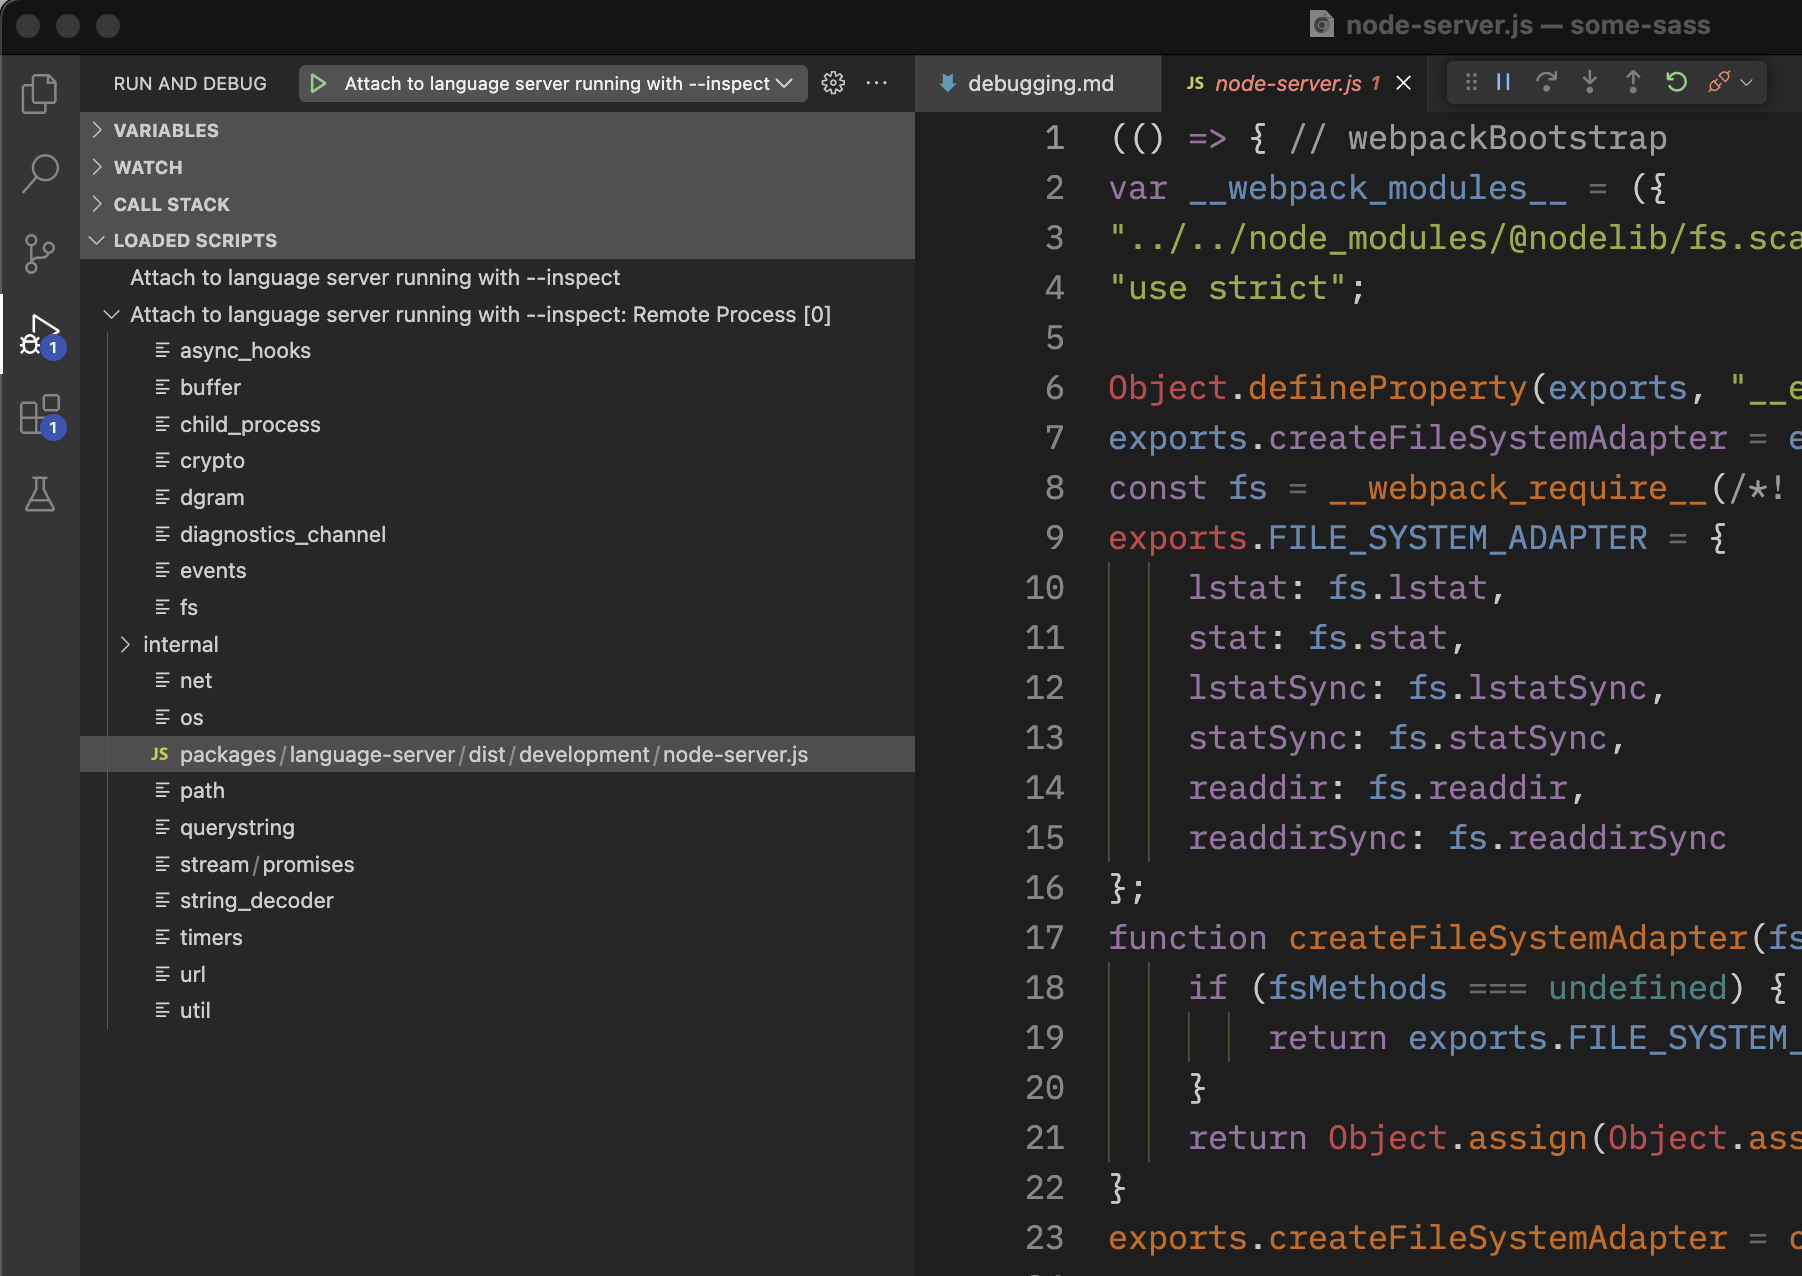
Attach to a running language server
If you need to debug an interaction in an editor other than Visual Studio Code,
you can run the language server using Node with the --inspect flag.
For example, in Sublime Text, this should be the command:
{
	"command": ["${node_bin}", "--inspect", "${server_path}", "--stdio", "--debug"]
}
Note that we also use the --debug flag in order to run the language server’s non-minified bundle.
You can then attach an inspector client.
In VS Code, once the debugger is attached, you should be able to find the language server’s script in the Loaded scripts section. There you can place breakpoints to step through the code you want to inspect.